
In this tutorial, I will show you how to create a map for RViz (3D visualizer program for ROS) from a floor plan or blueprint. Creating a map for RViz is an important step for enabling a robot to navigate autonomously in an environment.
We often use a robot’s LIDAR to build a map. That is fine and good, but you can often build a better, more accurate map if you create one from a floor plan or blueprint you already have on hand.
Real-World Applications
This project has a number of real-world applications:
- Indoor Delivery Robots
- Room Service Robots
- Robot Vacuums
- Order Fulfillment
- Factories
Prerequisites
Directions
I will largely follow this YouTube video here, which explains the process step-by-step.
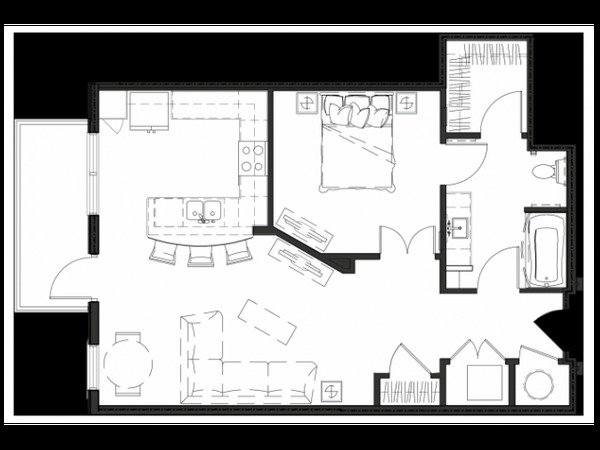
The first thing you need to do is to grab a floor plan or blueprint. Make sure it is in .png format.
Save the image to the directory where you want to eventually load your map.
I will create a new folder inside the catkin_ws called maps.
cd ~/catkin_ws
mkdir maps
cd maps
Install the map server.
sudo apt-get install ros-melodic-map-server
Edit the image file as you wish using a program like Paint.net.
Convert the image to binary format using OpenCV. Here is the code for that. I named the program convert_to_binary.py.
import cv2 # Import OpenCV

# read the image file
img = cv2.imread('mii_floor_plan_4.png')

ret, bw_img = cv2.threshold(img, 220, 255, cv2.THRESH_BINARY)

# converting to its binary form
bw = cv2.threshold(img, 240, 255, cv2.THRESH_BINARY)

# Display and save image
cv2.imshow("Binary", bw_img)
cv2.imwrite("mii_floor_plan_4_binary.png", bw_img)
cv2.waitKey(0)
cv2.destroyAllWindows()
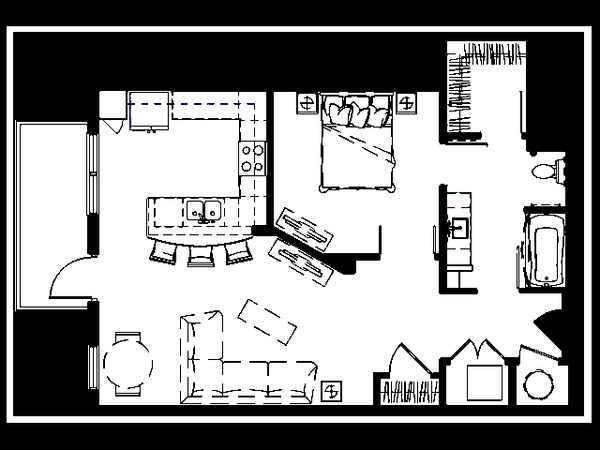
The name of my image is mii_floor_plan_4_binary.png. Here is the image.
Now, let’s create our .pgm and .yaml map files. ROS needs both of these file formats to display the map on RViz. Write the code below inside the same directory as your .png image file.
gedit MakeROSMap.py
import numpy as np
import cv2
import math
import os.path

#
#  This is a start for the map program
#
prompt = '> '

print("What is the name of your floor plan you want to convert to a ROS map:")
file_name = input(prompt)
print("You will need to choose the x coordinates horizontal with respect to each other")
print("Double Click the first x point to scale")
#
# Read in the image
#
image = cv2.imread(file_name)
#
# Some variables
#
ix,iy = -1,-1
x1 = [0,0,0,0]
y1 = [0,0,0,0]
font = cv2.FONT_HERSHEY_SIMPLEX
#
# mouse callback function
# This allows me to point and
# it prompts me from the command line
#
def draw_point(event,x,y,flags,param):
  global ix,iy,x1,y1n,sx,sy
  if event == cv2.EVENT_LBUTTONDBLCLK:
    ix,iy = x,y
    print(ix,iy)
#
# Draws the point with lines around it so you can see it
#
    image[iy,ix]=(0,0,255)
    cv2.line(image,(ix+2,iy),(ix+10,iy),(0,0,255),1)
    cv2.line(image,(ix-2,iy),(ix-10,iy),(0,0,255),1)
    cv2.line(image,(ix,iy+2),(ix,iy+10),(0,0,255),1)
    cv2.line(image,(ix,iy-2),(ix,iy-10),(0,0,255),1)
#
# This is for the 4 mouse clicks and the x and y lengths
#
    if x1[0] == 0:
      x1[0]=ix
      y1[0]=iy
      print('Double click a second x point')
    elif (x1[0] != 0 and x1[1] == 0):
      x1[1]=ix
      y1[1]=iy
      prompt = '> '
      print("What is the x distance in meters between the 2 points?")
      deltax = float(input(prompt))
      dx = math.sqrt((x1[1]-x1[0])**2 + (y1[1]-y1[0])**2)*.05
      sx = deltax / dx
      print("You will need to choose the y coordinates vertical with respect to each other")
      print('Double Click a y point')
    elif (x1[1] != 0 and x1[2] == 0):
      x1[2]=ix
      y1[2]=iy
      print('Double click a second y point')
    else:
      prompt = '> '
      print("What is the y distance in meters between the 2 points?")
      deltay = float(input(prompt))
      x1[3]=ix
      y1[3]=iy
      dy = math.sqrt((x1[3]-x1[2])**2 + (y1[3]-y1[2])**2)*.05
      sy = deltay/dy
      print(sx, sy)
      res = cv2.resize(image, None, fx=sx, fy=sy, interpolation = cv2.INTER_CUBIC)
      # Convert to grey
      res = cv2.cvtColor(res, cv2.COLOR_BGR2GRAY)
      cv2.imwrite("KEC_BuildingCorrected.pgm", res );
      cv2.imshow("Image2", res)
      #for i in range(0,res.shape[1],20):
        #for j in range(0,res.shape[0],20):
          #res[j][i][0] = 0
          #res[j][i][1] = 0
          #res[j][i][2] = 0
      #cv2.imwrite("KEC_BuildingCorrectedDots.pgm",res)
	    # Show the image in a new window
	    #  Open a file
      prompt = '> '
      print("What is the name of the new map?")
      mapName = input(prompt)

      prompt = '> '
      print("Where is the desired location of the map and yaml file?")
      print("NOTE: if this program is not run on the TurtleBot, Please input the file location of where the map should be saved on TurtleBot. The file will be saved at that location on this computer. Please then tranfer the files to TurtleBot.")
      mapLocation = input(prompt)
      completeFileNameMap = os.path.join(mapLocation, mapName +".pgm")
      completeFileNameYaml = os.path.join(mapLocation, mapName +".yaml")
      yaml = open(completeFileNameYaml, "w")
      cv2.imwrite(completeFileNameMap, res );
	    #
	    # Write some information into the file
	    #
      yaml.write("image: " + mapLocation + "/" + mapName + ".pgm\n")
      yaml.write("resolution: 0.050000\n")
      yaml.write("origin: [" + str(-1) + "," +  str(-1) + ", 0.000000]\n")
      yaml.write("negate: 0\noccupied_thresh: 0.65\nfree_thresh: 0.196")
      yaml.close()
      exit()

cv2.namedWindow('image', cv2.WINDOW_NORMAL)
cv2.setMouseCallback('image',draw_point)
#
#  Waiting for a Esc hit to quit and close everything
#
while(1):
  cv2.imshow('image',image)
  k = cv2.waitKey(20) & 0xFF
  if k == 27:
    break
  elif k == ord('a'):
    print('Done')
cv2.destroyAllWindows()
To run the code, type:
python MakeROSMap.py
If that doesn’t work on your system, you might need to type:
python3 MakeROSMap.py
When the program asks you for the desired location, press Enter.
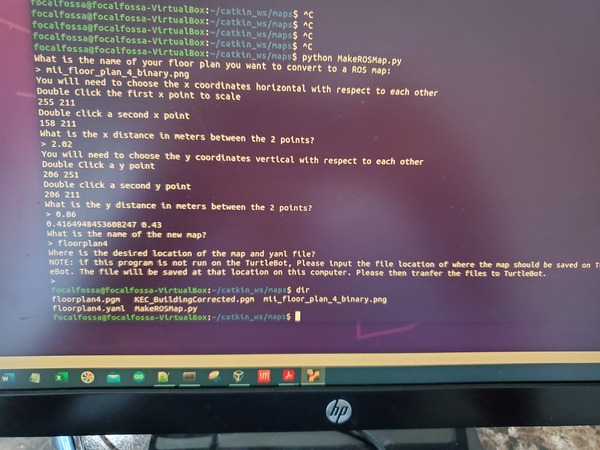
My two output files are floorplan4.pgm and floorplan4.yaml.
Open the yaml file and put the full path for the pgm image in the image tag.
gedit floorplan4.yaml
image: /home/focalfossa/catkin_ws/maps/floorplan4.pgm
resolution: 0.050000
origin: [-1,-1, 0.000000]
negate: 0
occupied_thresh: 0.65
free_thresh: 0.196
To find out the full path, you can go to the File Explorer in Linux and right-click on the image. Then go to Properties.
Save the file and close it.
To view the map, you can run the following command in a new terminal window to get the ROS Master started.
cd ~/catkin_ws/maps
roscore
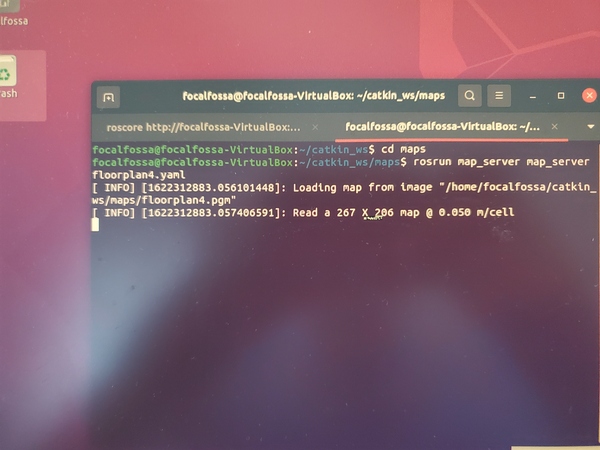
Now load the map. In a new terminal window, type:
rosrun map_server map_server floorplan4.yaml
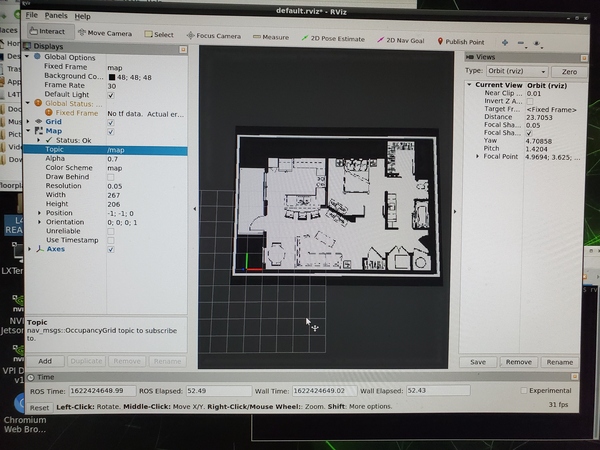
Open rviz in another terminal.
rviz
Click Add in the bottom left, and add the Map display.
Click OK.
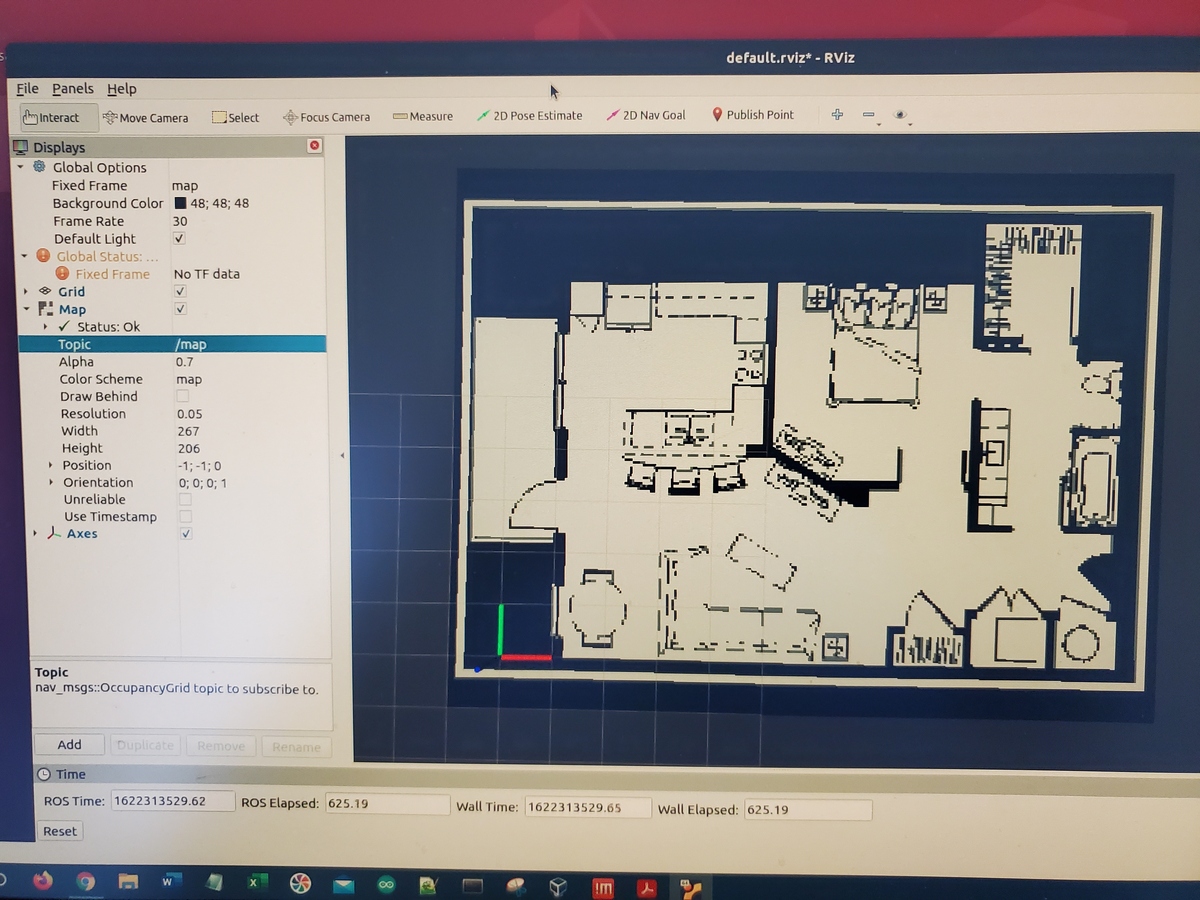
Under Topic under the Map section, select /map.
You should see the saved map on your screen.
That’s it. Keep building!