
In this tutorial, I will teach you what an occupancy grid map is. If you work in ROS long enough, you will eventually learn how to build an occupancy grid map.
In this post, I built an occupancy grid map from scratch to enable a robot to navigate safely around a room.
Real-World Applications
This project has a number of real-world applications:
- Indoor Delivery Robots
- Mapping of Underground Mines, Caves, and Hard-to-Reach Environments
- Robot Vacuums
- Order Fulfillment
- Factories
What is a Grid Map?
Imagine you want to create a robot to navigate across a factory floor. In order to navigate from one point to another with precision, the robot needs to have a map of the floor. We can represent the factory floor as a grid composed of, for example, 1 meter x 1 meter cells. The grid has a horizontal axis (i.e. x axis) and a vertical axis ( y axis).
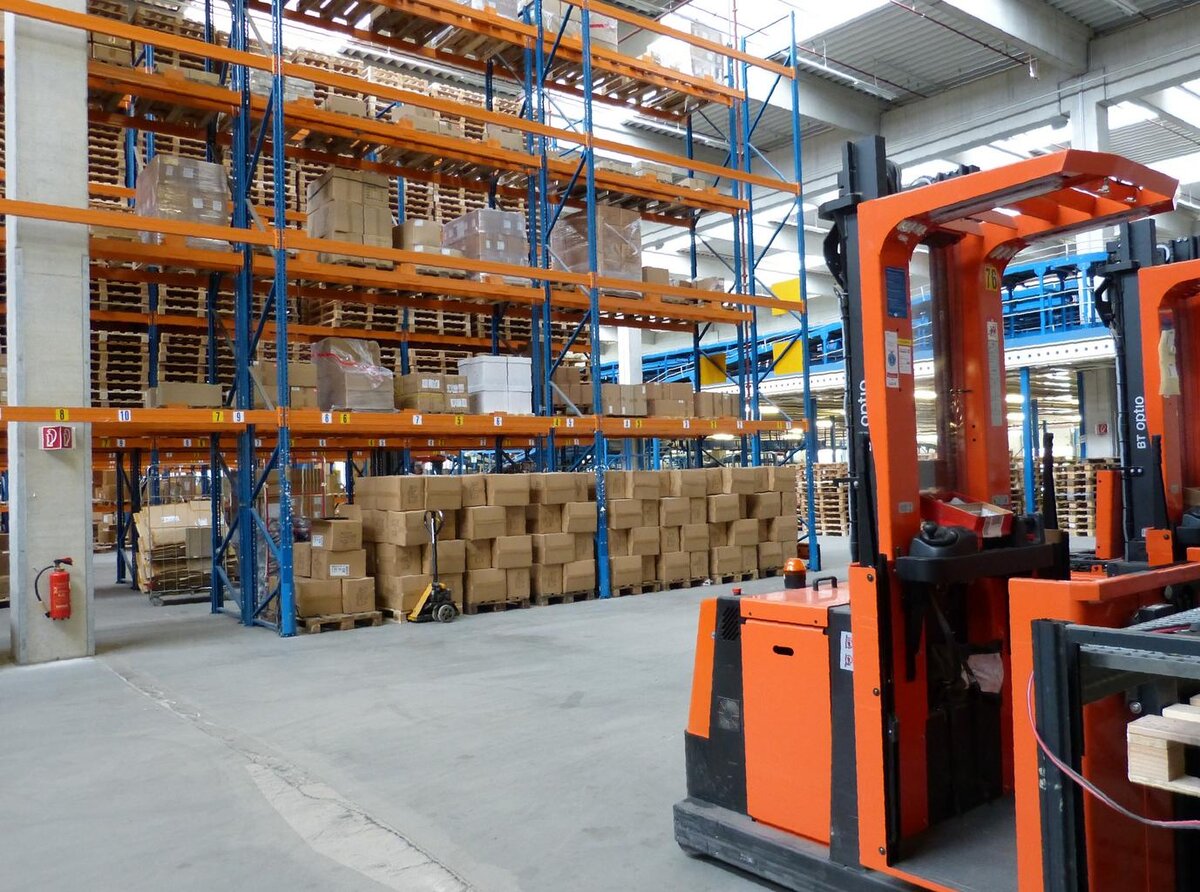
The image below is an example grid map of a factory floor. The big objects within the grid are obstacles (e.g. shelves).
The cool thing about a grid map is that we can determine what is in each cell by looking up the coordinate. For example, we can see in the image above that a shelf is located at (x=6, y=8). Therefore, that cell is occupied. However, open factory floor is located at (x=3, y=3). That cell is not occupied.
We can use a grid map to abstractly represent any indoor environment, including a house, apartment, and office. A robot’s position in the environment at any given time is relative to the corner of the map (x=0, y=0).
Knowing what part of a factory floor is open space and what part of a factory floor contains obstacles helps a robot properly plan the shortest, collision-free path from one point to another.
One other thing we need to keep in mind is that I assumed the map above has 1 meter spacing between each grid cell. For example, let’s say a robot’s location in the real world is recorded as (3.5, 4.3). On the grid cell, this location would correspond to cell (x=3, y=4) because the grid map is 1 meter resolution.
But what if we wanted to change the map resolution to 0.1 meter spacing between each grid cell? Let’s suppose the robot reported its location as (3.5, 4.3). What would the corresponding location be on the grid map?
(3.5 * (1 cell/0.1 meters), 4.3 * (1 cell/0.1 meters)) = (35, 43)
Thus, for a 0.1 resolution grid map, a robot that reports its position as (3.5, 4.3) corresponds to a grid map location of (35, 43).
What is an Occupancy Grid Map?
In an occupancy grid map, each cell is marked with a number that indicates the likelihood the cell contains an object. The number is often 0 (free space) to 100 (100% likely occupied). Unscanned areas (i.e. by the LIDAR, ultrasonic sensor, or some other object detection sensor) would be marked -1.
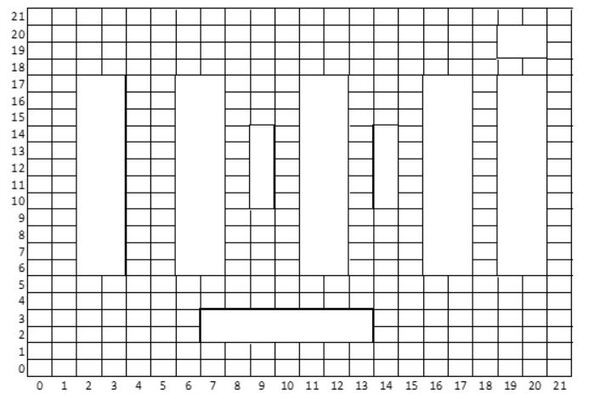
For example, consider the map below.
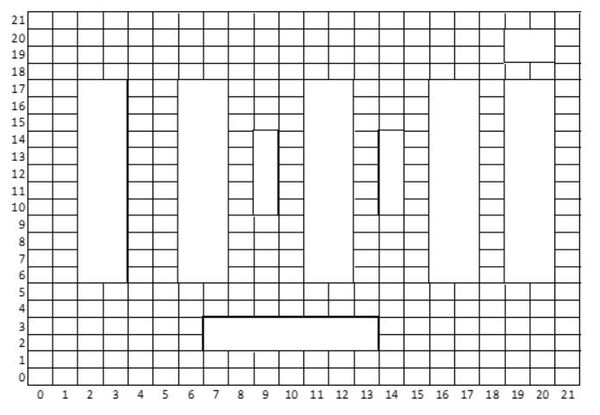
An occupancy grid map might look like the image below. Note the robot is in blue, and the LIDAR is the red square. The black lines are laser beams.
That’s it. Keep building!