Requirements
Develop a program in Python to draw an E at the center of an input image.
- Program must be developed using Python 3.x.
- Program must use scikit-image library — a simple and popular open source library for image processing in Python.
- The input image must be a color image.
- The letter must be at the center of the image and must be created by updating pixels, not by using any of the drawing functions.
- The final output must be a side-by-side image created using matplotlib.
- Must test the same code with two different images or two different sizes.
You Will Need
- Anaconda and Jupyter Notebooks or a Python IDE
Directions
Find any two images/photos.
Create a new Jupyter Notebook.
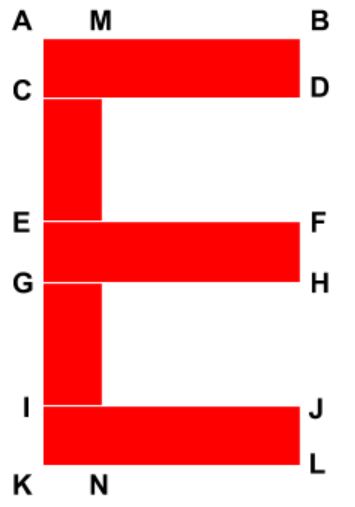
Here are the critical reference points for the letter E. These points mark the corners of the four rectangles that make up the letter E.
Here is the pdf of my Jupyter notebook.
Here is the raw code for the program in Python:
#!/usr/bin/env python
# coding: utf-8
# # Project 1 – Introduction to Python scikit-image
#
# ## Author
# Addison Sears-Collins
# ## Date Created
# 9/4/2019
# ## Python Version
# 3.7
# ## Description
# This program draws an E at the center of an input image.
# ## Purpose
# The purpose of this assignment is to introduce the basic functions of the Python scikit-image
# library -- a simple and popular open source library for image processing in Python. The scikitimage
# extends scipy.ndimage to provide a set of image processing routines including I/O, color
# and geometric transformations, segmentation, and other basic features.
# ## File Path
# In[1]:
# Move to the directory where the input images are located
get_ipython().run_line_magic('cd', 'D:\\Dropbox\\work')
# List the files in that directory
get_ipython().run_line_magic('ls', '')
# ## Code
# In[2]:
# Import scikit-image
import skimage
# Import module to read and write images in various formats
from skimage import io
# Import matplotlib functionality
import matplotlib.pyplot as plt
# Import numpy
import numpy as np
# Set the color of the E
# [red, green, blue]
COLOR_OF_E = [255, 0, 0]
# In[3]:
# Show the critical points of E
from IPython.display import Image
Image(filename = "e_critical_points.PNG", width = 200, height = 200)
# In[4]:
def e_generator(y_dim, x_dim):
"""
Generates the coordinates of the E
:param y_dim int: The y dimensions of the input image
:param x_dim int: The x dimensions of the input image
:return: The critical coordinates
:rtype: list
"""
# Set all the critical points
A = [int(0.407 * y_dim), int(0.423 * x_dim)]
B = [int(0.407 * y_dim), int(0.589 * x_dim)]
C = [int(0.488 * y_dim), int(0.423 * x_dim)]
D = [int(0.488 * y_dim), int(0.589 * x_dim)]
E = [int(0.572 * y_dim), int(0.423 * x_dim)]
F = [int(0.572 * y_dim), int(0.581 * x_dim)]
G = [int(0.657 * y_dim), int(0.423 * x_dim)]
H = [int(0.657 * y_dim), int(0.581 * x_dim)]
I = [int(0.735 * y_dim), int(0.423 * x_dim)]
J = [int(0.735 * y_dim), int(0.589 * x_dim)]
K = [int(0.819 * y_dim), int(0.423 * x_dim)]
L = [int(0.819 * y_dim), int(0.589 * x_dim)]
M = [int(0.407 * y_dim), int(0.47 * x_dim)]
N = [int(0.819 * y_dim), int(0.47 * x_dim)]
return A,B,C,D,E,F,G,H,I,J,K,L,M,N
# In[5]:
def plot_image_with_e(image, A, B, C, D, E, F, G, H, I, J, K, L, M, N):
"""
Plots an E on an input image
:param image: The input image
:param A, B, etc. list: The coordinates of the critical points
:return: image_with_e
:rtype: image
"""
# Copy the image
image_with_e = np.copy(image)
# Top horizontal rectangle
image_with_e[A[0]:C[0], A[1]:B[1], :] = COLOR_OF_E
# Middle horizontal rectangle
image_with_e[E[0]:G[0], E[1]:F[1], :] = COLOR_OF_E
# Bottom horizontal rectangle
image_with_e[I[0]:K[0], I[1]:J[1], :] = COLOR_OF_E
# Vertical connector rectangle
image_with_e[A[0]:K[0], A[1]:M[1], :] = COLOR_OF_E
# Display image
plt.imshow(image_with_e);
return image_with_e
# In[6]:
def print_image_details(image):
"""
Prints the details of an input image
:param image: The input image
"""
print("Size: ", image.size)
print("Shape: ", image.shape)
print("Type: ", image.dtype)
print("Max: ", image.max())
print("Min: ", image.min())
# In[7]:
def compare(original_image, annotated_image):
"""
Compare two images side-by-side
:param original_image: The original input image
:param annotated_image: The annotated-version of the original input image
"""
# Compare the two images side-by-side
f, (ax0, ax1) = plt.subplots(1, 2, figsize=(20,10))
ax0.imshow(original_image)
ax0.set_title('Original', fontsize = 18)
ax0.axis('off')
ax1.imshow(annotated_image)
ax1.set_title('Annotated', fontsize = 18)
ax1.axis('off')
# In[8]:
# Load the test image
image = io.imread("test_image.jpg")
# Store the y and x dimensions of the input image
y_dimensions = image.shape[0]
x_dimensions = image.shape[1]
# Print the image details
print_image_details(image)
# Display the image
plt.imshow(image);
# In[9]:
# Set all the critical points of the image
A,B,C,D,E,F,G,H,I,J,K,L,M,N = e_generator(y_dimensions, x_dimensions)
# Plot the image with E and store it
image_with_e = plot_image_with_e(image, A, B, C, D, E, F, G, H, I, J, K, L, M, N)
# Save the output image
plt.imsave('test_image_annotated.jpg', image_with_e)
# In[10]:
compare(image, image_with_e)
# In[11]:
# Load the first image
image = io.imread("architecture_roof_buildings_baked.jpg")
# Store the y and x dimensions of the input image
y_dimensions = image.shape[0]
x_dimensions = image.shape[1]
# Print the image details
print_image_details(image)
# Display the image
plt.imshow(image);
# In[12]:
# Set all the critical points of the image
A,B,C,D,E,F,G,H,I,J,K,L,M,N = e_generator(y_dimensions, x_dimensions)
# Plot the image with E and store it
image_with_e = plot_image_with_e(image, A, B, C, D, E, F, G, H, I, J, K, L, M, N)
# Save the output image
plt.imsave('architecture_roof_buildings_baked_annotated.jpg', image_with_e)
# In[13]:
compare(image, image_with_e)
# In[14]:
# Load the second image
image = io.imread("statue.jpg")
# Store the y and x dimensions of the input image
y_dimensions = image.shape[0]
x_dimensions = image.shape[1]
# Print the image details
print_image_details(image)
# Display the image
plt.imshow(image);
# In[15]:
# Set all the critical points of the image
A,B,C,D,E,F,G,H,I,J,K,L,M,N = e_generator(y_dimensions, x_dimensions)
# Plot the image with E and store it
image_with_e = plot_image_with_e(image, A, B, C, D, E, F, G, H, I, J, K, L, M, N)
# Save the output image
plt.imsave('statue_annotated.jpg', image_with_e)
# In[16]:
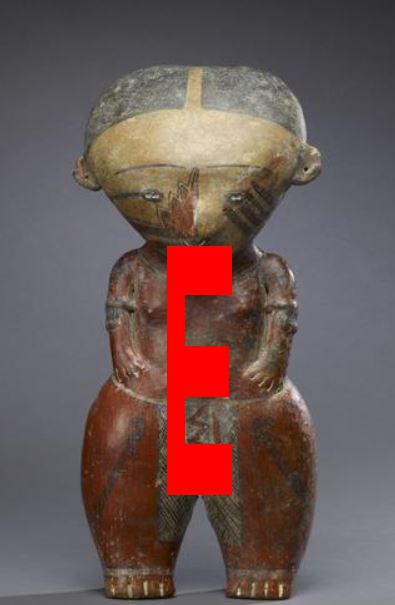
compare(image, image_with_e)
# In[ ]:
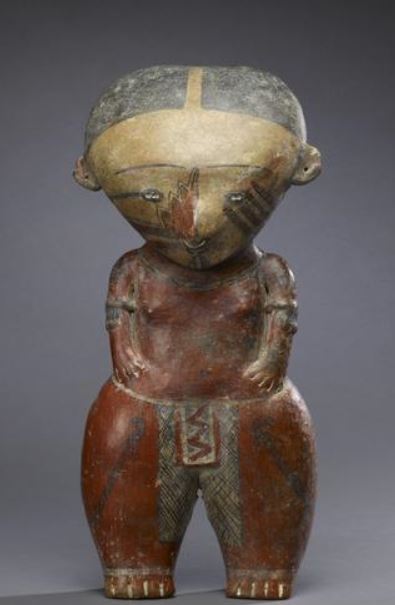
Example
Before
After