In this tutorial, we will explore how to use the rqt_console tool in ROS 2 to analyze and debug your robotic system. The rqt_console is a graphical user interface that displays log messages from various nodes in your ROS 2 system, making it easier to identify and diagnose issues.
Sure, you could run your program and scroll through the terminal window to see all the logs. But rqt_console makes that process a lot more efficient, enabling you to filter for exactly what you are looking for.
Prerequisites
- You have completed this tutorial: How to Simulate a Mobile Robot in Gazebo – ROS 2 Jazzy
- I am assuming you are using Visual Studio Code, but you can use any code editor.
All my code for this project is located here on GitHub.
Launch
Start rqt_console:
ros2 run rqt_console rqt_console
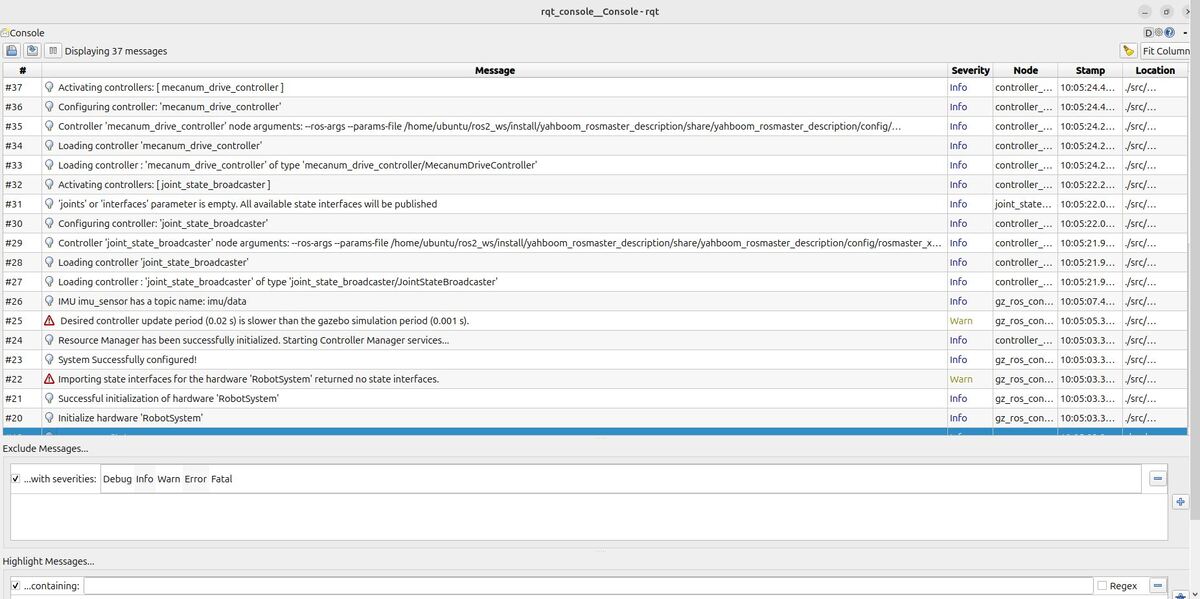
The rqt_console window will open.
As explained on the official ROS 2 documentation, the top section of the console is where log messages from your system will display.
The middle section is where you can filter the messages by excluding severity levels.
The bottom section is for highlighting messages that include a string you input.
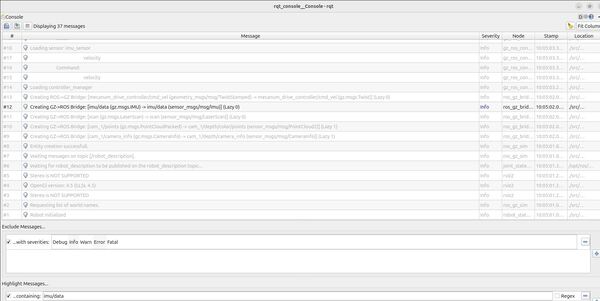
In the bottom section type: imu/data.
Open a terminal window, and type the following command to run the robot:
x3
or
bash ~/ros2_ws/src/yahboom_rosmaster/yahboom_rosmaster_bringup/scripts/rosmaster_x3_gazebo.sh
The message list at the top will highlight only the messages related to the IMU data topic.

Let’s type another string.
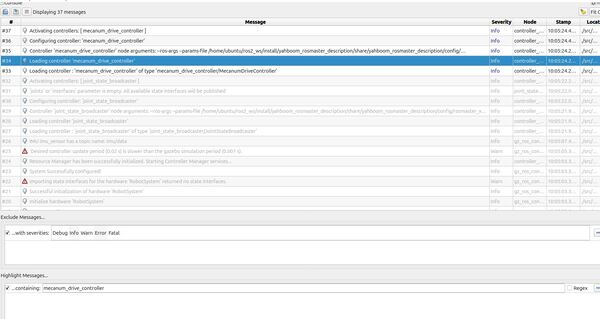
mecanum_drive_controller
You will see all the messages related to the mecanum drive controller.

That’s it! Keep building!

