In this project, we will learn how to annotate images using OpenCV — a popular and powerful open source library for image processing and computer vision.
OpenCV is a cross-platform library with wrappers for Python, Ruby, C#, JavaScript, and other languages designed for real-time image processing. OpenCV has methods for image I/O, filtering, motion tracking, segmentation, 3D reconstruction, as well as machine learning techniques such as boosting, support vector machines, and deep learning.
Requirements
- Design a software application using Python and OpenCV that allows users to click in an image, annotate a number of points within an image, and export the annotated points into a CSV file.
- Code must be implemented in Python and using OpenCV
- The input image and output CSV files will be provided as parameters.
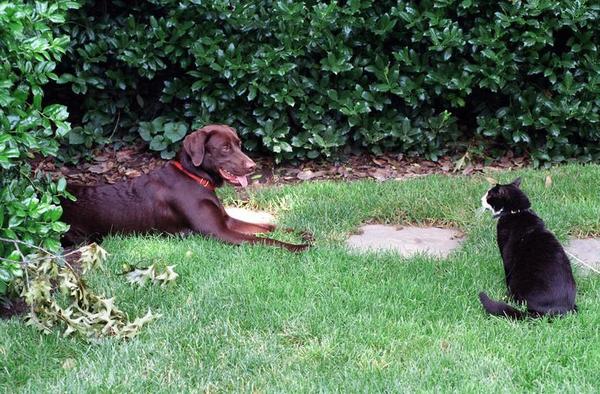
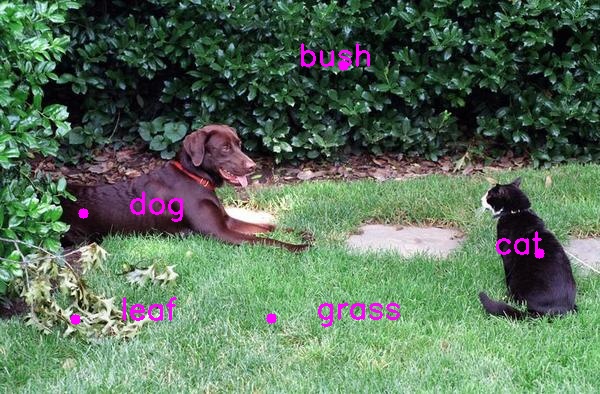
- Example: python annotate_images.py cat_dog.jpg cat_dog.csv
You Will Need
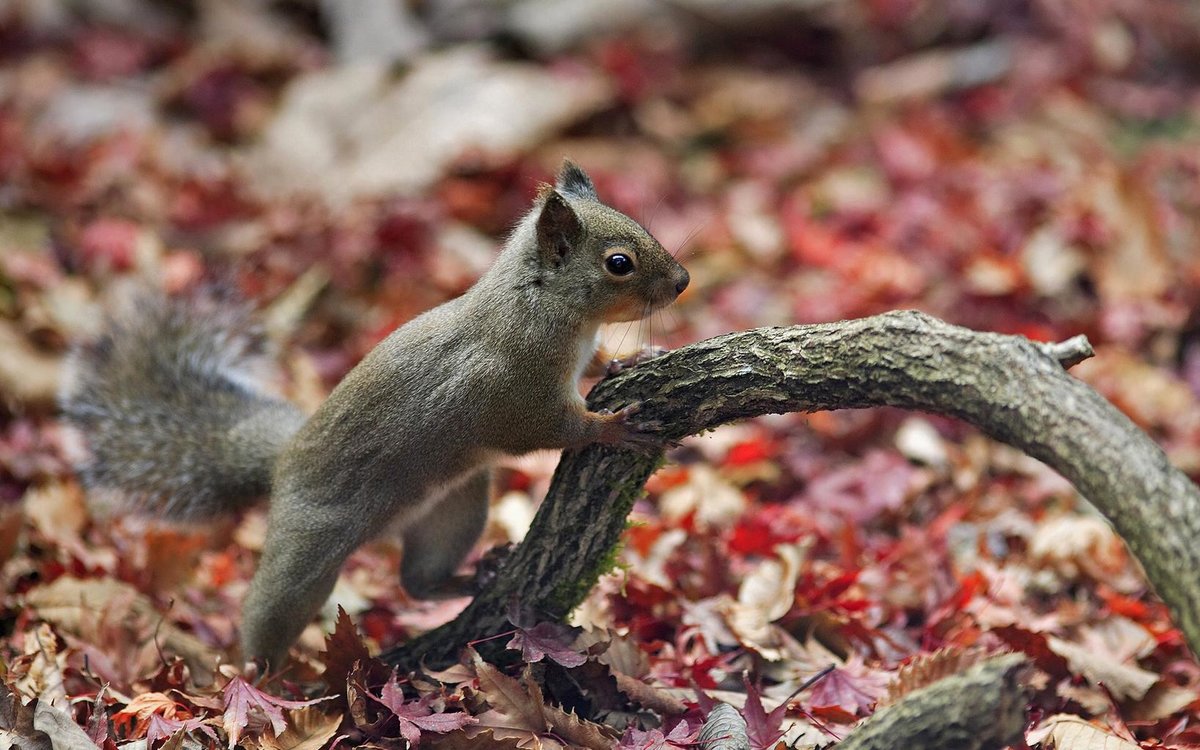
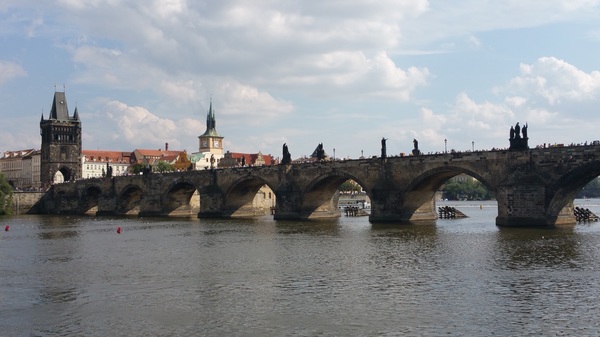
Input Images
Directions
To run the program, open up an Anaconda Prompt terminal.
Go to the proper directory.
Type python annotate_images.py cat_dog.jpg cat_dog.csv to run the program.
Here is the code:
import cv2 # Import the OpenCV library
import numpy as np # Import Numpy library
import pandas as pd # Import Pandas library
import sys # Enables the passing of arguments
# Project: Annotate Images Using OpenCV
# Author: Addison Sears-Collins
# Date created: 9/11/2019
# Python version: 3.7
# Description: This program allows users to click in an image, annotate a
# number of points within an image, and export the annotated points into
# a CSV file.
# Define the file name of the image
INPUT_IMAGE = sys.argv[1] # "cat_dog.jpg"
IMAGE_NAME = INPUT_IMAGE[:INPUT_IMAGE.index(".")]
OUTPUT_IMAGE = IMAGE_NAME + "_annotated.jpg"
output_csv_file = sys.argv[2]
# Load the image and store into a variable
# -1 means load unchanged
image = cv2.imread(INPUT_IMAGE, -1)
# Create lists to store all x, y, and annotation values
x_vals = []
y_vals = []
annotation_vals = []
# Dictionary containing some colors
colors = {'blue': (255, 0, 0), 'green': (0, 255, 0), 'red': (0, 0, 255),
'yellow': (0, 255, 255),'magenta': (255, 0, 255),
'cyan': (255, 255, 0), 'white': (255, 255, 255), 'black': (0, 0, 0),
'gray': (125, 125, 125),
'rand': np.random.randint(0, high=256, size=(3,)).tolist(),
'dark_gray': (50, 50, 50), 'light_gray': (220, 220, 220)}
def draw_circle(event, x, y, flags, param):
"""
Draws dots on double clicking of the left mouse button
"""
# Store the height and width of the image
height = image.shape[0]
width = image.shape[1]
if event == cv2.EVENT_LBUTTONDBLCLK:
# Draw the dot
cv2.circle(image, (x, y), 5, colors['magenta'], -1)
# Annotate the image
txt = input("Describe this pixel using one word (e.g. dog) and press ENTER: ")
# Append values to the list
x_vals.append(x)
y_vals.append(y)
annotation_vals.append(txt)
# Print the coordinates and the annotation to the console
print("x = " + str(x) + " y = " + str(y) + " Annotation = " + txt + "\n")
# Set the position of the text part of the annotation
text_x_pos = None
text_y_pos = y
if x < (width/2):
text_x_pos = int(x + (width * 0.075))
else:
text_x_pos = int(x - (width * 0.075))
# Write text on the image
cv2.putText(image, txt, (text_x_pos,text_y_pos), cv2.FONT_HERSHEY_SIMPLEX, 1, colors['magenta'], 2)
cv2.imwrite(OUTPUT_IMAGE, image)
# Prompt user for another annotation
print("Double click another pixel or press 'q' to quit...\n")
print("Welcome to the Image Annotation Program!\n")
print("Double click anywhere inside the image to annotate that point...\n")
# We create a named window where the mouse callback will be established
cv2.namedWindow('Image mouse')
# We set the mouse callback function to 'draw_circle':
cv2.setMouseCallback('Image mouse', draw_circle)
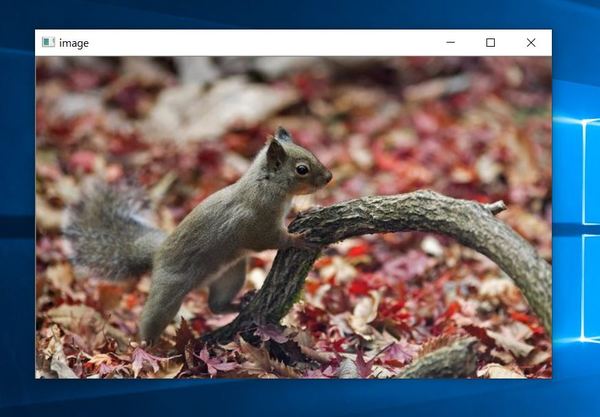
while True:
# Show image 'Image mouse':
cv2.imshow('Image mouse', image)
# Continue until 'q' is pressed:
if cv2.waitKey(20) & 0xFF == ord('q'):
break
# Create a dictionary using lists
data = {'X':x_vals,'Y':y_vals,'Annotation':annotation_vals}
# Create the Pandas DataFrame
df = pd.DataFrame(data)
print()
print(df)
print()
# Export the dataframe to a csv file
df.to_csv(path_or_buf = output_csv_file, index = None, header=True)
# Destroy all generated windows:
cv2.destroyAllWindows()
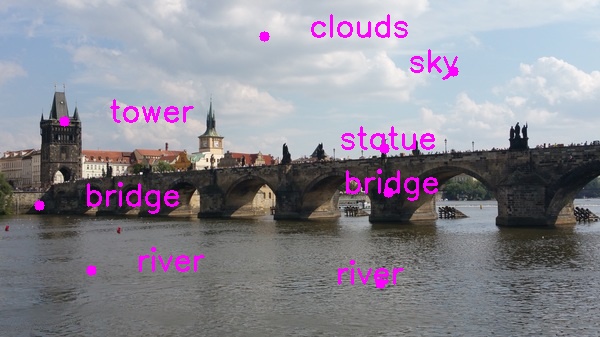
Output Images
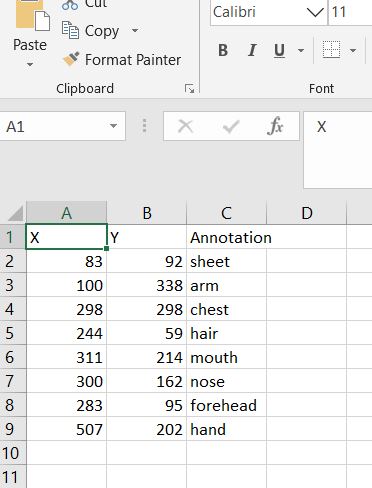
CSV Output
Here is the output for the csv file for the baby photo above: