
Given an image as input, how do we get the corresponding histogram using OpenCV? First, let us take a look at what a histogram is, then let us take a look at how to create one given an image.
What is a Histogram?
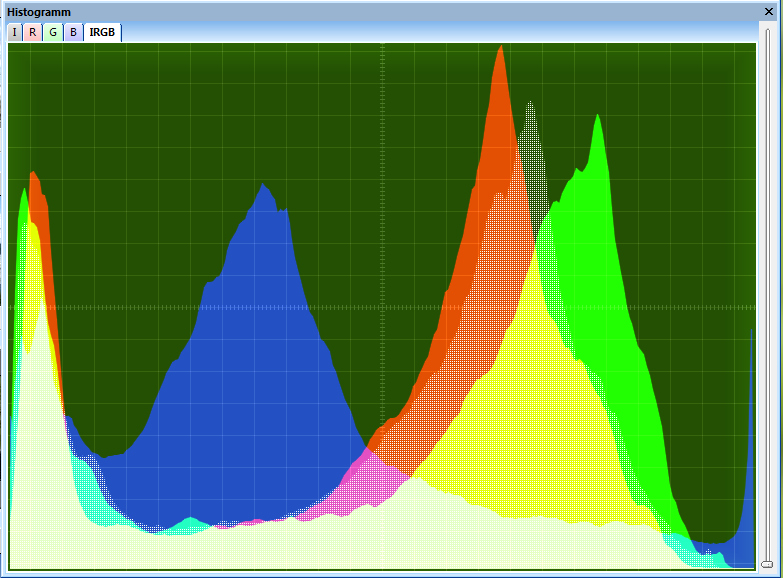
A histogram is another way of looking at an image. It is a graph that shows pixel brightness values on the x-axis (e.g. 0 [black] to 255 [white] for grayscale images) and the corresponding number (i.e. frequency) of pixels (for each brightness value) on the y-axis.
How to Create an Image Histogram Using OpenCV
There are two links I particularly like that show how to create the image histogram given an input image.
I like these tutorials because they lead the reader through all the essentials of how to find and analyze image histograms, step-by-step. This process boils down to the following code:
# Import the required libraries
import cv2  # Open CV
from matplotlib import pyplot as plt  #Matplotlib for plotting

# Read the input image
img = cv2.imread('example.jpg',0)

# Calculate the frequency of pixels in the brightness range 0 - 255
histr = cv2.calcHist([img],[0],None,[256],[0,256])

# Plot the histogram and display
plt.plot(histr)
plt.show()